New Car Market Profiling and EV/Hybrid Predictions for 2020
Data provided by vehicle history and data expert Cartell.ie was reported recently in the media on the profile of new cars purchased in Ireland in the first two months of the year and (in findings published by Electronomous) the growing popularity of electric vehicles and hybrids. This is the extended research on which those releases were based. This blog covers the value of the new car fleet in Ireland, the CO2 emissions attributable to the fleet and the anticipated number of electric vehicles and hybrids sold in Ireland in 2020. We also report on a breakdown of the price-points for new cars sold and the buying trends in the Irish new car market over the last several years.
Cartell.ie looked at the first two months of the year for every year between 2003 and 2019 and the data yielded the following results:
Why has the average value been increasing?
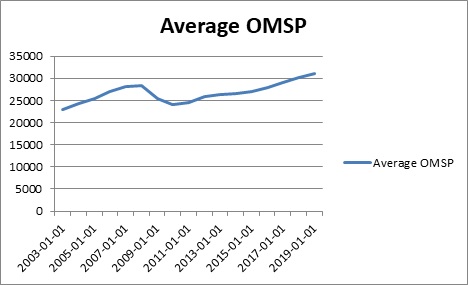
In 2018, Cartell reported to the market that the value of the average new car sold in Ireland has been increasing steadily. We reported a figure of €30,130 for the first 6 months of 2018 in a detailed analysis. The final end-of-year figure for 2018 returned €30,082 – the first time that average values for a full year have fallen above €30,000.
In 2019, for the first two months, the average new car value has broken through the €31,000 marker returning €31,003 – an increase of 3 per cent.
Graph 1: Average value of new private vehicles (Open Market Selling Price (OMSP)) bought in Ireland 2003-2019 (Source: Cartell Carstat)
Cartell.ie considered several possible reasons for the continued increase in the average value of a private vehicle purchased in Ireland over the last several years:
- Consumers may be opting for more expensive vehicles, or more expensive vehicle types like SUVs and Crossover vehicles, or MPVs
- Buyers may want larger cars. The country had a recorded population of 4.23 million in Census 2006 which increased to 4.76 million in Census 2016. This increase may have weighed on buyer decisions, for instance, buyers with younger children may need additional space
- Buyer has more cash to spend or more available lines of credit. Financial products such as Personal Contract Plans (PCPs) came to prominence in Ireland during the recession as manufacturers sought a means to provide direct lines of credit to potential buyers
- Vehicles are more expensive to manufacture, to comply with NCAP safety ratings, for example, this increases the cost of manufacture: the consumer now often expects certain higher specification items as standard too – larger wheels, alloys, on-board technology, Advanced Driver Assistance Systems (ADAS) features – which all increase the manufacture cost
Table 1: Inflation adjusted Average Values 2004 to 2019 (first two months of each year) (Source: Cartell, Carstat)
| Year | New Private Car Sales | Average Value | Total Sales Value | Inflation Index | Total Sales Value Adjusted | Average Value Adjusted | % Change |
| 2004 | 49653 | 24,824 | 1,232,586,072 | 93.1 | 1,323,937,779 | 26,664 | |
| 2005 | 60065 | 25,941 | 1,558,146,165 | 95.3 | 1,634,990,729 | 27,220 | 2.09% |
| 2006 | 66529 | 26,997 | 1,796,083,413 | 100 | 1,796,083,413 | 26,997 | -0.82% |
| 2007 | 69894 | 28,106 | 1,964,440,764 | 104.7 | 1,876,256,699 | 26,844 | -0.57% |
| 2008 | 69767 | 28,108 | 1,961,010,836 | 105.8 | 1,853,507,406 | 26,567 | -1.03% |
| 2009 | 23798 | 25,856 | 615,321,088 | 100.8 | 610,437,587 | 25,651 | -3.45% |
| 2010 | 28071 | 23,940 | 672,019,740 | 102.1 | 658,197,591 | 23,448 | -8.59% |
| 2011 | 33065 | 24,758 | 818,623,270 | 104.6 | 782,622,629 | 23,669 | 0.95% |
| 2012 | 32393 | 26,059 | 844,129,187 | 105.7 | 798,608,502 | 24,654 | 4.16% |
| 2013 | 27490 | 26,210 | 720,512,900 | 105.9 | 680,371,010 | 24,750 | 0.39% |
| 2014 | 35014 | 26,656 | 933,333,184 | 105.6 | 883,838,242 | 25,242 | 1.99% |
| 2015 | 44870 | 27,108 | 1,216,335,960 | 105.7 | 1,150,743,576 | 25,646 | 1.60% |
| 2016 | 60658 | 28,385 | 1,721,777,330 | 105.7 | 1,628,928,411 | 26,854 | 4.71% |
| 2017 | 54853 | 29,481 | 1,617,121,293 | 106.1 | 1,524,148,250 | 27,786 | 3.47% |
| 2018 | 52454 | 30,082 | 1,577,921,228 | 106.3 | 1,484,403,789 | 28,299 | 1.85% |
| 2019 | 42813 | 31,003 | 1,327,331,439 | 107 | 1,240,496,672 | 28.975 | 2.39% |
As we said last year the buyer of a new vehicle is getting more features than before particularly on the safety side. Over time new-car-buyers have grown accustomed to a greater range of features and these are often rolled-out as standard in future generations as manufacturers add new features as additional extras. This cycle may increase the cost of manufacture on the one hand but it can also increase the price consumers are willing to spend to acquire features seen as desirable. Simple examples of this phenomenon are electric windows and alloy wheels. Possibly, the buyer in some cases may be opting for more expensive cars owing to more readily available lines of credit or simply because buyers are keen to buy a larger car when fuel economy and motor taxation figures have dropped so significantly across the board.
Larger, bulkier cars like SUVs are becoming fashionable. Often the reasons for a buyer opting for a vehicle of this type are based on practicalities like easier access to rear seats and loading areas. It stands to reason that vehicles of this type, as they are larger, are more expensive to manufacture. They can also increase the average levels of CO2.
One concern which arose from the introduction of the World Harmonised Light Duty Vehicle Testing Protocol (WLTP) was whether more stringent rules on emissions testing would spell the end for optional extras in new cars. Based on this birds-eye market analysis by Cartell.ie there is no strong evidence this is taking place.
CO2 Emissions – the trend is unfortunately upwards
In 2018, Cartell looked at the state of CO2 emissions in the private transport sector. It had been then reported that Ireland faced a significant fine in 2020 for a “serious rise in Irish greenhouse gas emissions” – which had been partly attributed to the transport sector where emissions increased by 3.7 per cent in 2016.
Unfortunately Cartell reports today the situation has actually worsened in respect of our emissions of CO2. In a worrying development for Government there has been an upturn in the average CO2 emissions of new vehicles sold in Ireland: in 2018 average emissions increased for the first time since 2004 recording a reading of 113g CO2 /km. More concerning is that the trend is now upwards – the reading recorded for the first two months of 2019 is 115g CO2 /km.
Graph 2: Average CO2 of new private vehicles bought in Ireland 2003-2019 (Source: Cartell Carstat)
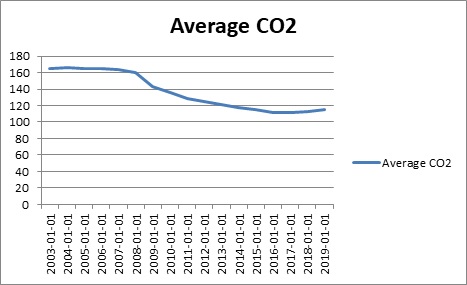
Table 2: Average CO2 of new private vehicles bought in Ireland 2003-2019 (Source: Cartell Carstat)
| Date | CO2 |
| 2003-01-01 | 165 |
| 2004-01-01 | 166 |
| 2005-01-01 | 165 |
| 2006-01-01 | 165 |
| 2007-01-01 | 164 |
| 2008-01-01 | 159 |
| 2009-01-01 | 142 |
| 2010-01-01 | 136 |
| 2011-01-01 | 129 |
| 2012-01-01 | 125 |
| 2013-01-01 | 121 |
| 2014-01-01 | 117 |
| 2015-01-01 | 115 |
| 2016-01-01 | 112 |
| 2017-01-01 | 111 |
| 2018-01-01 | 113 |
| 2019-01-01 | 115 |
Remember, we are looking exclusively at new cars sold in Ireland so any arguments with respect to imported vehicles can be entirely discounted. The report considers whether the average emissions are possibly increasing in line with a buying trend towards purchase of more expensive vehicles, meaning these results are correlative with the general increase in the value of new vehicles sold. However, this wouldn’t really explain the increase in emissions per se as manufacturers have invested considerable amounts of money to reduce emissions in their fleet in-line with overarching concerns for the environment globally.
The reason for the increase may simply be the buying trend towards larger more practical vehicles like SUVs in favour of saloons. Certainly the buyer is spending more money as will be more in evidence when the reader looks at the next section of this report.
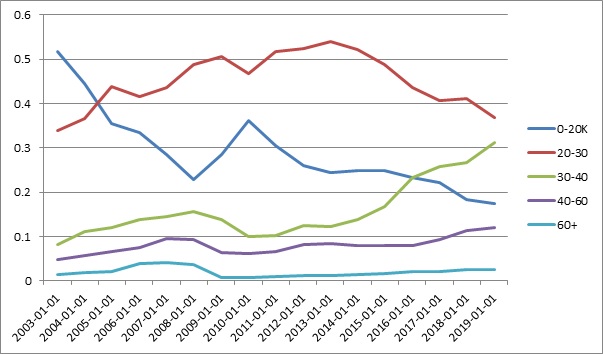
Buyers buying different vehicles – more money to spend?
One intriguing aspect we found in the data is the changing consumer trend towards buying vehicles in the €30k to €40k price bracket. This is now the second most popular price bracket for purchasers overall and it is well on course to becoming the most popular bracket – possibly as early as next year – as the gap is closing markedly. This can be seen in the graph below.
Graph 3: Value of New Vehicles purchased in Ireland by price bracket 2003-2019 (Source: Cartell Carstat)
The price bracket €30k to €40k is also the bracket where the average value lays – currently €31,003. As more and more purchasers become accustomed to spending in excess of €30,000 so the cycle continues as more and more different buying options are presented by the various manufacturers in this bracket to feed the demand.
This is in contrast to the position in the lowest price bracket – less than €20k where fewer and fewer consumer purchases are taking place. This is reflected in the graph which shows a significantly sharp decline in the numbers of buyers purchasing in this bracket: in 2003 this bracket constituted half of the entire market and now brings in less than 20 per cent of the overall sales by numbers of units. Again, the effect is cyclical as the smaller number of purchases in this bracket reflects, or results in, a smaller number of buying options available in the segment as manufacturers concentrate their efforts elsewhere.
Graph 4: CO2 emissions by price bracket 2003-2019 (Source: Cartell Carstat)
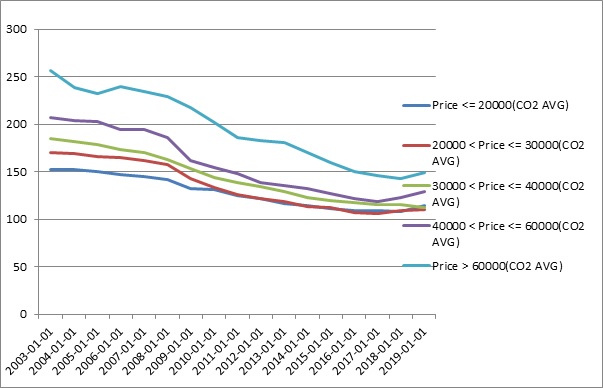
Another interesting aspect to this consumer shift is the commensurate impact on CO2 emissions: The graph above shows that, in line with the general upward trend in the market, CO2 emissions are increasing over the course of the past couple of years except for one bracket – the €30,000 to €40,000 price bracket. This is exactly the price bracket where Electric Vehicles (EVs) enter the frame as this is the price bracket where those vehicles are sold and consequently EVs are clearly impacting on average emissions in that bracket. Though EVs are not yet being sold in numbers which are having the same impact on CO2 emissions in the market overall.
Electric Vehicles (EVs), hybrids and the consumer shift to more expensive vehicles
One of the reasons mentioned widely for the slow growth in Electric Vehicles (EVs) is the increased manufacturing costs for vehicles of this type and consequently the higher purchase price of this vehicle-type. To some extent this higher price-point has been offset by Government incentives. Our report looks in more details at the value of EVs at the time of first purchase in the market and returns the following results.
Table 3: Value and units of Electric Vehicles sold first two months of the year 2017 to 2019 (Source: Cartell Carstat)
| Date | Units | Average Value |
| 2017-03-01 | 229 | 26261 |
| 2018-03-01 | 174 | 40540 |
| 2019-03-01 | 1045 | 33417 |
The table above shows the recent growth in the numbers of EVs – up 6 times on last year. It also shows the price-point for this vehicle-type has settled just above €33,000. Combined with the growth in this price bracket (see previous section) and the recent consumer trend towards (i) buying a car which is more expensive and (ii) buying an EV the market should be prime for EV sales in 2020/21.
Table 4: Value and units of Hybrid Vehicles sold first two months of the year 2017 to 2019 (Source: Cartell Carstat)
| Date | Numbers | Average Value |
| 2017-03-01 | 1976 | 31340 |
| 2018-03-01 | 3122 | 31940 |
| 2019-03-01 | 3760 | 34680 |
In terms of hybrid sales the market has advanced 20 per cent. The overall numbers of hybrids sold in the first 2 months of 2019 displays a healthy annualised increase of 20 per cent. This growth weighs against the backdrop of a decline in diesel sales – down 23 per cent.
One thing that is open to interpretation is the future market demand outcome – whether demand will move more towards Electric Vehicles or towards their hybrid equivalents. Self-charging hybrids now make up 7.7 per cent of the car market against 2.2 per cent for EVs. In volume terms, hybrid growth continues on an equivalent level to EVs.
The advantage with the hybrid is that it is much closer to what the average consumer is already familiar with and it fends off so-called range anxiety. The case for the EV turns more on the additional environmental benefits a car of this type delivers (in terms of its day-to-day performance) and the fact that range anxiety will also become less of an issue as additional battery capacity coming on stream pushes vehicles of this type to deliver more range in the future.
Michael Gaynor, Marketing Director, Toyota Ireland told Cartell.ie:
We continue to see consumers make the shift from diesel to self-charging hybrids where 80% of all our car sales in 2019 will be hybrids. Our next generation hybrid engines can now deliver up to 60 per cent zero emissions driving, giving consumers much of the benefit of a pure electrified car without the compromise of re-recharging or range anxiety. It’s why we expect self-charging hybrids to account for 12 per cent of private car sales in 2020, growing to 20 per cent by 2021.”
Obviously there is a Brexit uncertainty in the market, however, this point aside for the moment, we would expect to see self-charging Hybrids grow to 12% or 1 in 8 of new cars sold in 2020. Very healthy growth in EVs in 2020 – more than 3,000 units for the first 2 months of next year is easily achievable and 5,000 units is not impossible. This anticipates EVs being sold at a value in the low €30,000s and the continuing consumer advance towards buying cars in the €30,000 to €40,000 bracket. As we expect this to be the most popular bracket for new car sales within the next two years this should yield significant growth in EVs over that period as consumers are faced with a like-for-like choice in terms of price knowing that EVs can yield savings down the line in terms of running costs. So, in January and February 2020 we can make a prediction of sales in the region of €100m+ EV sales.
Notes
- While compiling these figures Cartell assessed, for all the years, the Open Market Selling Price for each vehicle purchased, based on the Jato List price.
- The study deducted public grants and VRT rebates for environmentally friendly vehicles such as Electric Vehicles and Plug-In Hybrid Electric Vehicles (EVs/PHEVs).
- The values given for New Private Sales in the Tables are those successfully matched to the OMSP. The study successfully matched in excess of 98 per cent of vehicles.