CAR REGISTRATION DATA REVEALS OWNERS HOLD VEHICLES LONGER

Latest data from vehicle history and data expert Cartell and vehicle sales platform CarsIreland.ie report that the age of the fleet is increasing as date of car registration data reveals owners are holding onto their vehicles longer during the pandemic. The overall picture shows the age of the private fleet, both native and imported, has returned to a level last seen in July 2017.
Cartell.ie tracked the age of the fleet (both native fleet and imported fleet) using car registration data on the first day of each month between January 1999 and July 2021. Between July 2020 and July 2021 the fleet as a whole has advanced in age by 30 days from an average of 3150 days to 3180 days (+30 days). For the equivalent period the imported fleet has also increased from 3254 days to 3289 days (+35 days). The average age of a private car in Ireland, both native and imported, is now 8.7 years. The average age of an imported car in Ireland stands at 9 years. An indigenous Irish vehicle’s average age is currently 8.58 years.
Graph 1: Age and Size of Private Fleet, Native fleet, Imports 1999 to 2021 (Source: Cartell Carstat)
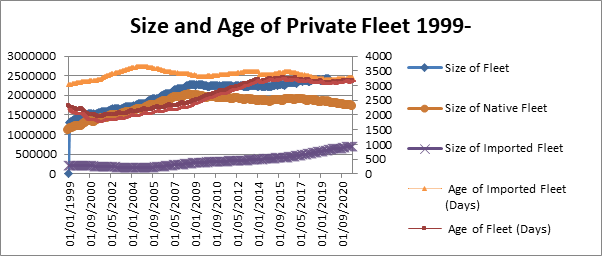
The age of the fleet oscillates throughout the year as vehicles leave the fleet and others enter. However the increase in age of the fleet since March 2020 (+81 days) has been particularly notable. This coincides with the worldwide pandemic. In March 2020 the difference in age between the imported fleet and the native fleet was +137 days while today the difference in age has widened to +153 days meaning imported vehicles are, on average, older than they had been.
Jeff Aherne, Innovation Lead, Cartell.ie, says:
“Obviously there is a lot going on both with the pandemic, which has altered buying habits and when people get new car registrations. It has also led to a drop in numbers of imported vehicles, and furthermore there is currently a global chip shortage in the industry for new vehicles. The fleet is certainly getting older at the moment. Whether this is part of a wider trend we can expect to see continue or whether the fleet age will begin to fall again when we leave the pandemic is an open question at this point. We would expect to see the age starting to decline again when things open up.”
Historic Car Registration Data on Age of Fleet in Ireland
Table 1: Age of Native Fleet and Imported Fleet in Years – 2020 to 2021 (Source: Cartell Carstat)
| Date | Native Fleet Age | Imported Fleet Age | Combined Fleet Age |
| 01/07/2020 | 8.52 | 8.9 | 8.62 |
| 01/08/2020 | 8.46 | 8.9 | 8.58 |
| 01/09/2020 | 8.48 | 8.9 | 8.59 |
| 01/10/2020 | 8.49 | 8.89 | 8.60 |
| 01/11/2020 | 8.53 | 8.898 | 8.63 |
| 01/12/2020 | 8.58 | 8.90 | 8.67 |
| 01/01/2021 | 8.63 | 8.88 | 8.70 |
| 01/02/2021 | 8.55 | 8.90 | 8.65 |
| 01/03/2021 | 8.52 | 8.91 | 8.63 |
| 01/04/2021 | 8.52 | 8.93 | 8.64 |
| 01/05/2021 | 8.53 | 8.95 | 8.65 |
| 01/06/2021 | 8.55 | 8.98 | 8.67 |
| 01/07/2021 | 8.58 | 9.00 | 8.70 |
Table 2: Age of Native Fleet and Imported Fleet in Years – July 1999 to July 2021 (Source: Cartell Carstat)
| Date | Native Fleet Age | Imported Fleet Age | Combined Fleet Age |
| 01/07/1999 | 5.62 | 8.43 | 6.04 |
| 01/07/2000 | 5.08 | 8.62 | 5.56 |
| 01/07/2001 | 4.83 | 8.81 | 5.31 |
| 01/07/2002 | 5.03 | 9.33 | 5.48 |
| 01/07/2003 | 5.19 | 9.67 | 5.62 |
| 01/07/2004 | 5.44 | 9.99 | 5.84 |
| 01/07/2005 | 5.62 | 9.88 | 5.99 |
| 01/07/2006 | 5.81 | 9.59 | 6.18 |
| 01/07/2007 | 5.99 | 9.39 | 6.35 |
| 01/07/2008 | 6.24 | 9.31 | 6.601 |
| 01/07/2009 | 6.72 | 9.02 | 7.02 |
| 01/07/2010 | 7.16 | 9.11 | 7.43 |
| 01/07/2011 | 7.51 | 9.27 | 7.76 |
| 01/07/2012 | 7.91 | 9.40 | 8.14 |
| 01/07/2013 | 8.37 | 9.50 | 8.55 |
| 01/07/2014 | 8.58 | 9.20 | 8.69 |
| 01/07/2015 | 8.76 | 9.34 | 8.86 |
| 01/07/2016 | 8.75 | 9.47 | 8.88 |
| 01/07/2017 | 8.65 | 9.24 | 8.77 |
| 01/07/2018 | 8.53 | 8.95 | 8.63 |
| 01/07/2019 | 8.44 | 8.80 | 8.53 |
| 01/07/2020 | 8.52 | 8.90 | 8.62 |
| 01/07/2021 | 8.58 | 9.00 | 8.70 |